Each year, ICSD voluntarily releases its Equity Report card, an expansive report of how the district has fared in terms of enrollment, state test scores, absenteeism, and more. The report card also provides information on how this data varies between students of different races, FRPL (Free or Reduced Price Lunch) statuses, and students’ disability statuses. The 2022 report card (for the 2021-2022 school year) is the first post-pandemic Equity Report Card. It tells the story of how ICSD has recovered from the ongoing effects of the pandemic. After sitting down with District Data Analyst and equity report card creator, Lynn Klankowski, I gathered more insight into how the district is interpreting this new data.
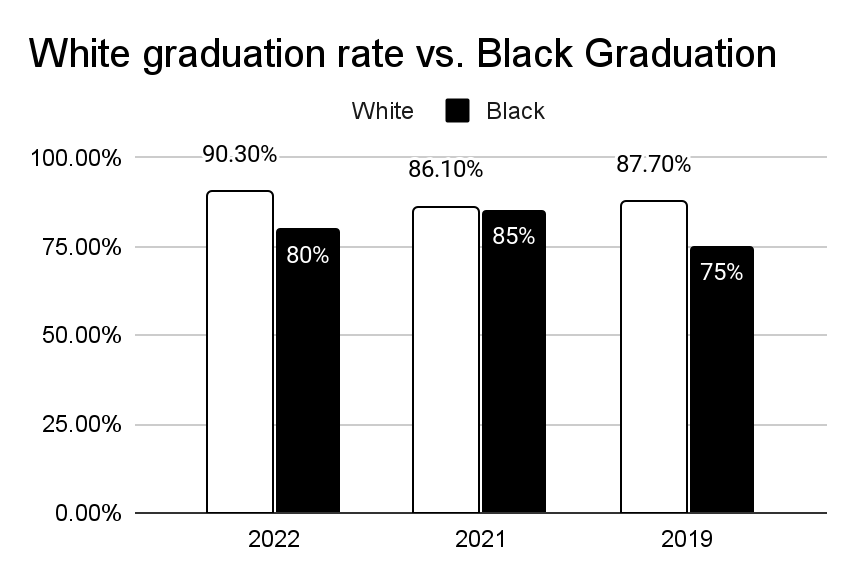
The first number that is significant is the four-year graduation rate, currently 87.8 percent, a statistic Klankowski says the district focuses much of its efforts on. The average graduation rate in New York State for the Class of 2022 was 86 percent, to compare. In ICSD, the graduation rate increased by 3 percentage points from 2021 (see Figure 1). The graduation rate for white students in 2022 was the highest since 2016, and the graduation rate for Black students increased by nearly 25 percent from 2021. Although she acknowledges it as a victory for the district, Klankowski wonders how sustainable this graduation rate will be for the future, theorizing that the increase was due to the lack of Regents exams the Class of 2022 had to take as compared to the Class of 2020 and the Class of 2021. When Regents requirements return at full, these rates could fall again. If New York State were to eliminate high-stakes assessments like the Regents and switch to a focus on course credit, Klankoski believes that “graduation could be more attainable and hopefully less culturally biased.”
Staff and teacher data are included for the first time since 2015, showing a disproportionate amount of non-white classroom teachers to non-white students (Figure 3). The data was included this year due to a new New York State requirement: Data on employee race is now taken at hire so that data can be reported properly.
Flipping through the rest of the report card, perhaps the most startling number was the rate of math proficiency among Black students on the state test from 3rd grade to 8th grade: 6.3 percent, dropping a startling 12.1 percentage points from 2019. Only 6 out of 96 Black students tested “proficient” (3 or above) on the Math state test. The percent proficient among all students is still low but is considerably more normal at 44.7 percent, down from 53.5 percent in 2019, a number Ms. Klankowski is hoping will be improved by online math programs.

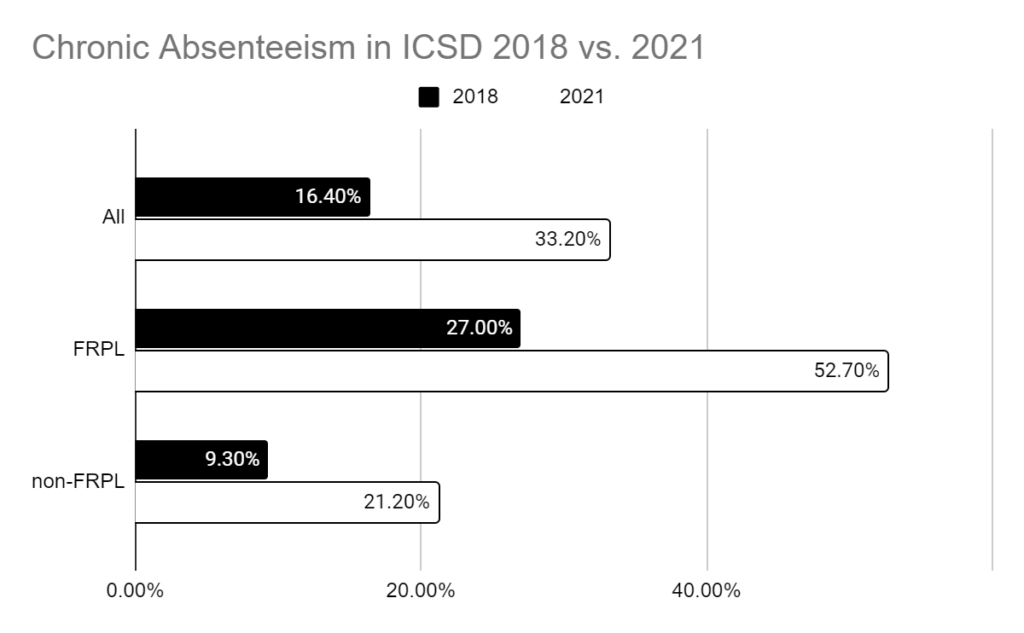
Another large increase, perhaps the most noticeable difference from last year (among all students) was the rise in chronic absenteeism. Klankowski explains it’s “the topic of every conversation: How can we get kids in school?” A student is counted as being chronically absent if they miss more than 10 percent of school days in a year. In the 2021-2022 school year, the rate of chronically absent students was 33.2 percent compared to 2018’s 16.4 percent (Figure 2). The data analyst believes measuring absenteeism will be a baseline metric the district will be watching closely, theorizing the sharp uptick could be due to a lack of student engagement in the classroom, making them not want to come to school and students being more likely to stay home when sick.
Although she admits there is still a lot of work to be done, Klankowski wanted The Tattler to note a few things that deserve celebration, including the increase in elementary music participation, up 21.2 percent from 2021, the tightness in the gap between the percentage of Black teachers to Black students, and the increased graduation rate—despite potential shifts in the future.
Other noticeable points in the report included the consistent decline in enrollment overall and the consistent increase in the number of students with disabilities, both of which Klankowski is watching but are not sources of any concern. Otherwise, Klankowski hopes that initiatives such as getting students more involved in administrative decisions, decelerating math, and giving teachers more resources in classrooms will be the answers to a few of the district’s worst gaps.


